Many backend systems are built with .NET. If you have a service that tracks metrics — request counts, error rates, queue depths, or any time-series number — and you want to publish that data as a chart without building a frontend, you can do it with a few lines of HttpClient code.
This article shows how to create a persistent chart slot on PlotMarks and push data to it from a .NET application. The integration requires no SDK or NuGet package beyond what ships with the framework.
The scenario
An ASP.NET Core service counts incoming API requests per hour and publishes the current day's totals as an embedded bar chart. The chart is used on an internal status page. The service pushes a fresh dataset each hour; the page shows the latest numbers when someone opens it.
Architecture
flowchart LR
    S["One-time setup"] -->|"POST /api/charts\nchart ID"| A
    A["ASP.NET Core\nservice"] -->|"POST /api/charts/{id}/data\n(hourly)"| B[("PlotMarks\nchart slot")]
    B -->|"same URL"| C["Status page (iframe)"]
Chart creation is a one-time setup step, usually done manually from a console app or a startup routine. Data pushes happen on the production schedule — hourly in this case.
Prerequisites
- .NET 8 or later
- A PlotMarks account and API key — sign up free at plotmarks.com
PLOTMARKS_API_KEYset as an environment variable or app secret
No additional NuGet packages are required.
Step 1 — Create a chart slot
Run this once to provision the chart. You can place it in a Program.cs setup block, a one-time migration tool, or a simple console app. Save the chart ID that is returned.
using System.Net.Http;
using System.Net.Http.Json;

// ── Typed models ───────────────────────────────────────────────────────────

record ChartConfig(string title, string xLabel, string yLabel);
record CreateChartRequest(string type, string output_type, ChartConfig config);
record CreateChartResponse(string id, string embedUrl);

// ── Setup ──────────────────────────────────────────────────────────────────

const string BaseUrl = "https://www.plotmarks.com";
string apiKey = Environment.GetEnvironmentVariable("PLOTMARKS_API_KEY")
    ?? throw new InvalidOperationException("PLOTMARKS_API_KEY is not set");

using var client = new HttpClient();
client.DefaultRequestHeaders.Add("X-API-Key", apiKey);

// ── Create chart slot ──────────────────────────────────────────────────────

var createBody = new CreateChartRequest(
    type: "bar",
    output_type: "static_iframe",
    config: new ChartConfig(
        title: "API Requests — Today",
        xLabel: "Hour",
        yLabel: "Requests"
    )
);

using var createResponse = await client.PostAsJsonAsync($"{BaseUrl}/api/charts", createBody);
createResponse.EnsureSuccessStatusCode();

var chart = await createResponse.Content.ReadFromJsonAsync<CreateChartResponse>()
    ?? throw new InvalidOperationException("Empty response");

Console.WriteLine($"Chart ID : {chart.id}");
Console.WriteLine($"Embed URL: {chart.embedUrl}");
output_type: "static_iframe" creates a chart that shows the latest pushed dataset when a viewer loads the page. No in-page auto-refresh. This is appropriate here because the page is loaded on demand and hourly data does not need to update while someone has the page open.
Step 2 — Push data
Typically called from the part of your service that runs on the hourly schedule:
// ── Push hourly request counts ─────────────────────────────────────────────

// In production this comes from your metrics store.
// Keys are hour labels; values are request counts.
var hourlyCounts = new Dictionary<string, int>
{
    ["00:00"] = 412,
    ["01:00"] = 298,
    ["02:00"] = 187,
    ["03:00"] = 143,
    ["04:00"] = 201,
    ["05:00"] = 334,
    ["06:00"] = 589,
    ["07:00"] = 847,
    ["08:00"] = 1204,
    ["09:00"] = 1531,
    ["10:00"] = 1688,
    ["11:00"] = 1743
};

var dataPoints = hourlyCounts
    .Select(kvp => new Dictionary<string, object>
    {
        ["x"] = kvp.Key,
        ["Requests"] = kvp.Value
    })
    .ToList();

var pushBody = new
{
    plots = new[]
    {
        new
        {
            color = "#4F46E5",
            borderRadius = 4,
            data = dataPoints
        }
    }
};

string chartId = "ch_abc123"; // from the create step above
using var pushResponse = await client.PostAsJsonAsync(
    $"{BaseUrl}/api/charts/{chartId}/data",
    pushBody
);
pushResponse.EnsureSuccessStatusCode();
Console.WriteLine("Data pushed successfully");
Each call to POST /api/charts/{id}/data replaces the chart's entire dataset. There is no delta or append mode. Pushing a new dataset with 12 data points replaces the previous one — the chart always shows exactly what was in the most recent push.
Step 3 — Embed the chart
The embed URL returned during chart creation is public. No login or API key is needed to view it.
<iframe
  src="https://www.plotmarks.com/charts/ch_abc123"
  width="640"
  height="360"
  frameborder="0"
  style="border-radius: 8px"
></iframe>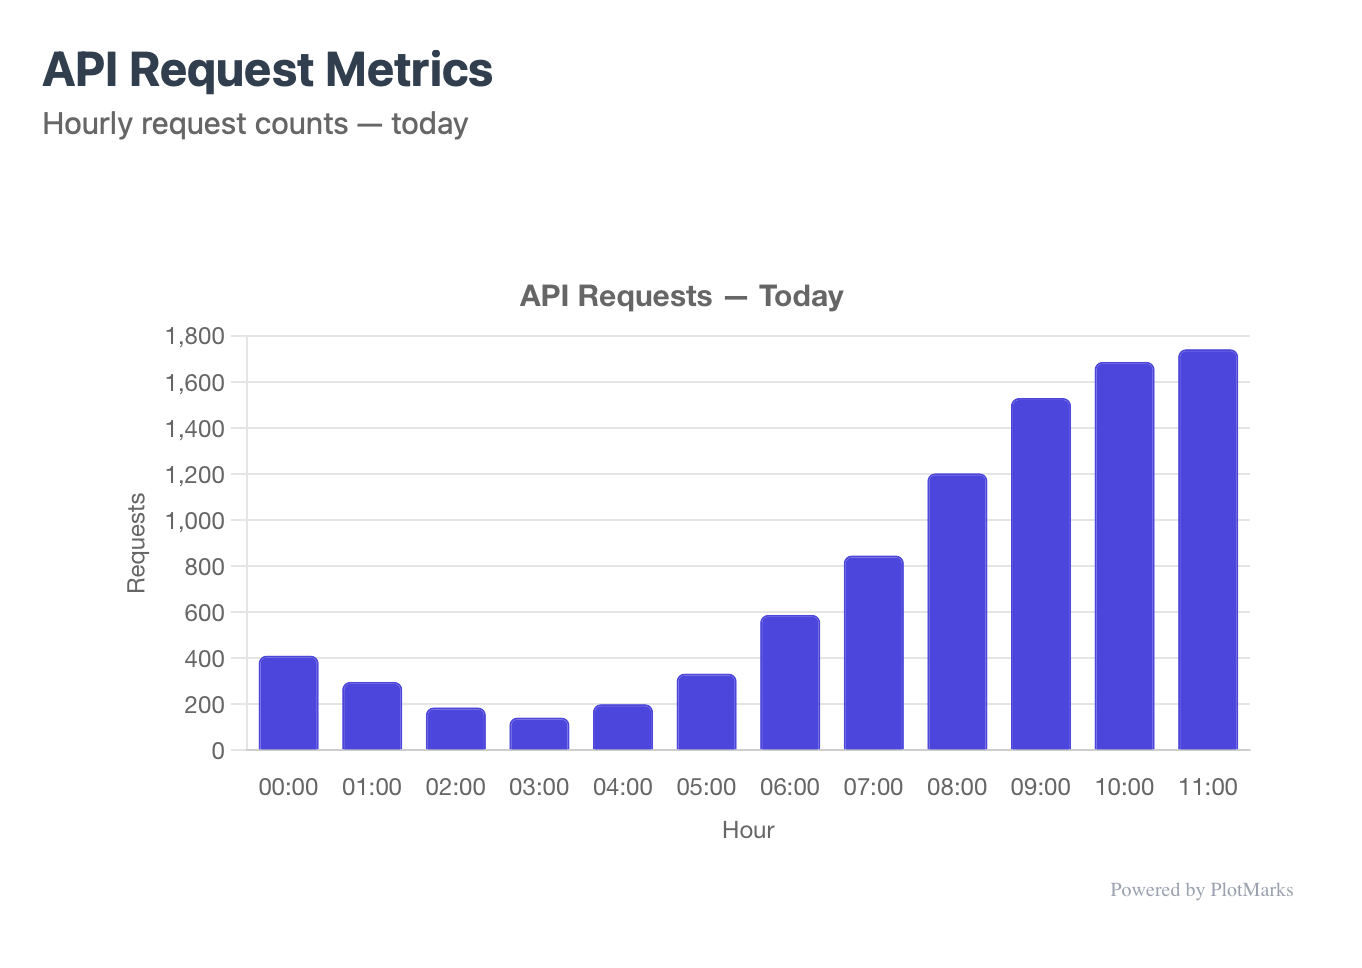
Making it a background service
If you want the push to happen automatically on a schedule inside the service itself, wrap it in a BackgroundService:
sequenceDiagram
    participant BS as BackgroundService
    participant MS as Metrics store
    participant PM as PlotMarks

    loop Every hour
        BS->>MS: query hourly counts
        MS-->>BS: data
        BS->>PM: POST /api/charts/{id}/data
        PM-->>BS: { ok: true }
        BS->>BS: wait until next hour boundary
    end
public class HourlyChartUpdater : BackgroundService
{
private readonly HttpClient _http;
private readonly string _chartId;
public HourlyChartUpdater(IHttpClientFactory factory, IConfiguration config)
{
_http = factory.CreateClient("plotmarks");
_chartId = config["PlotMarks:ChartId"]
?? throw new InvalidOperationException("PlotMarks:ChartId is not configured");
}
protected override async Task ExecuteAsync(CancellationToken stoppingToken)
{
while (!stoppingToken.IsCancellationRequested)
{
await PushCurrentHourlyData(stoppingToken);
// Wait until the next hour boundary
var now = DateTime.UtcNow;
var nextHour = now.AddHours(1).Date.AddHours(now.AddHours(1).Hour);
await Task.Delay(nextHour - now, stoppingToken);
}
}
private async Task PushCurrentHourlyData(CancellationToken ct)
{
// Retrieve from your metrics store
var counts = await GetHourlyCountsFromMetricsStore(ct);
var pushBody = new
{
plots = new[]
{
new
{
color = "#4F46E5",
borderRadius = 4,
data = counts.Select(c => new Dictionary<string, object>
{
["x"] = c.Hour,
["Requests"] = c.Count
}).ToList()
}
}
};
using var res = await _http.PostAsJsonAsync(
$"/api/charts/{_chartId}/data",
pushBody,
ct
);
res.EnsureSuccessStatusCode();
}
private Task<IEnumerable<(string Hour, int Count)>> GetHourlyCountsFromMetricsStore(
CancellationToken ct)
{
// Replace with your actual data source
throw new NotImplementedException();
}
}Register it in Program.cs:
builder.Services.AddHttpClient("plotmarks", client =>
{
    client.BaseAddress = new Uri("https://www.plotmarks.com");
    client.DefaultRequestHeaders.Add("X-API-Key", builder.Configuration["PlotMarks:ApiKey"]);
});
builder.Services.AddHostedService<HourlyChartUpdater>();
Switching to a live chart
If the background service is pushing data automatically, you may also want the chart to refresh in the browser without requiring a page reload. Switch output_type to "live_iframe" when creating the chart — for example if it is displayed on a TV screen or a monitoring wall:
var createBody = new CreateChartRequest(
    type: "bar",
    output_type: "live_iframe",
    config: new ChartConfig(
        title: "API Requests — Today",
        xLabel: "Hour",
        yLabel: "Requests"
    )
);
The data push code and the embed HTML stay exactly the same. The browser-side polling is handled by the embedded chart page automatically.
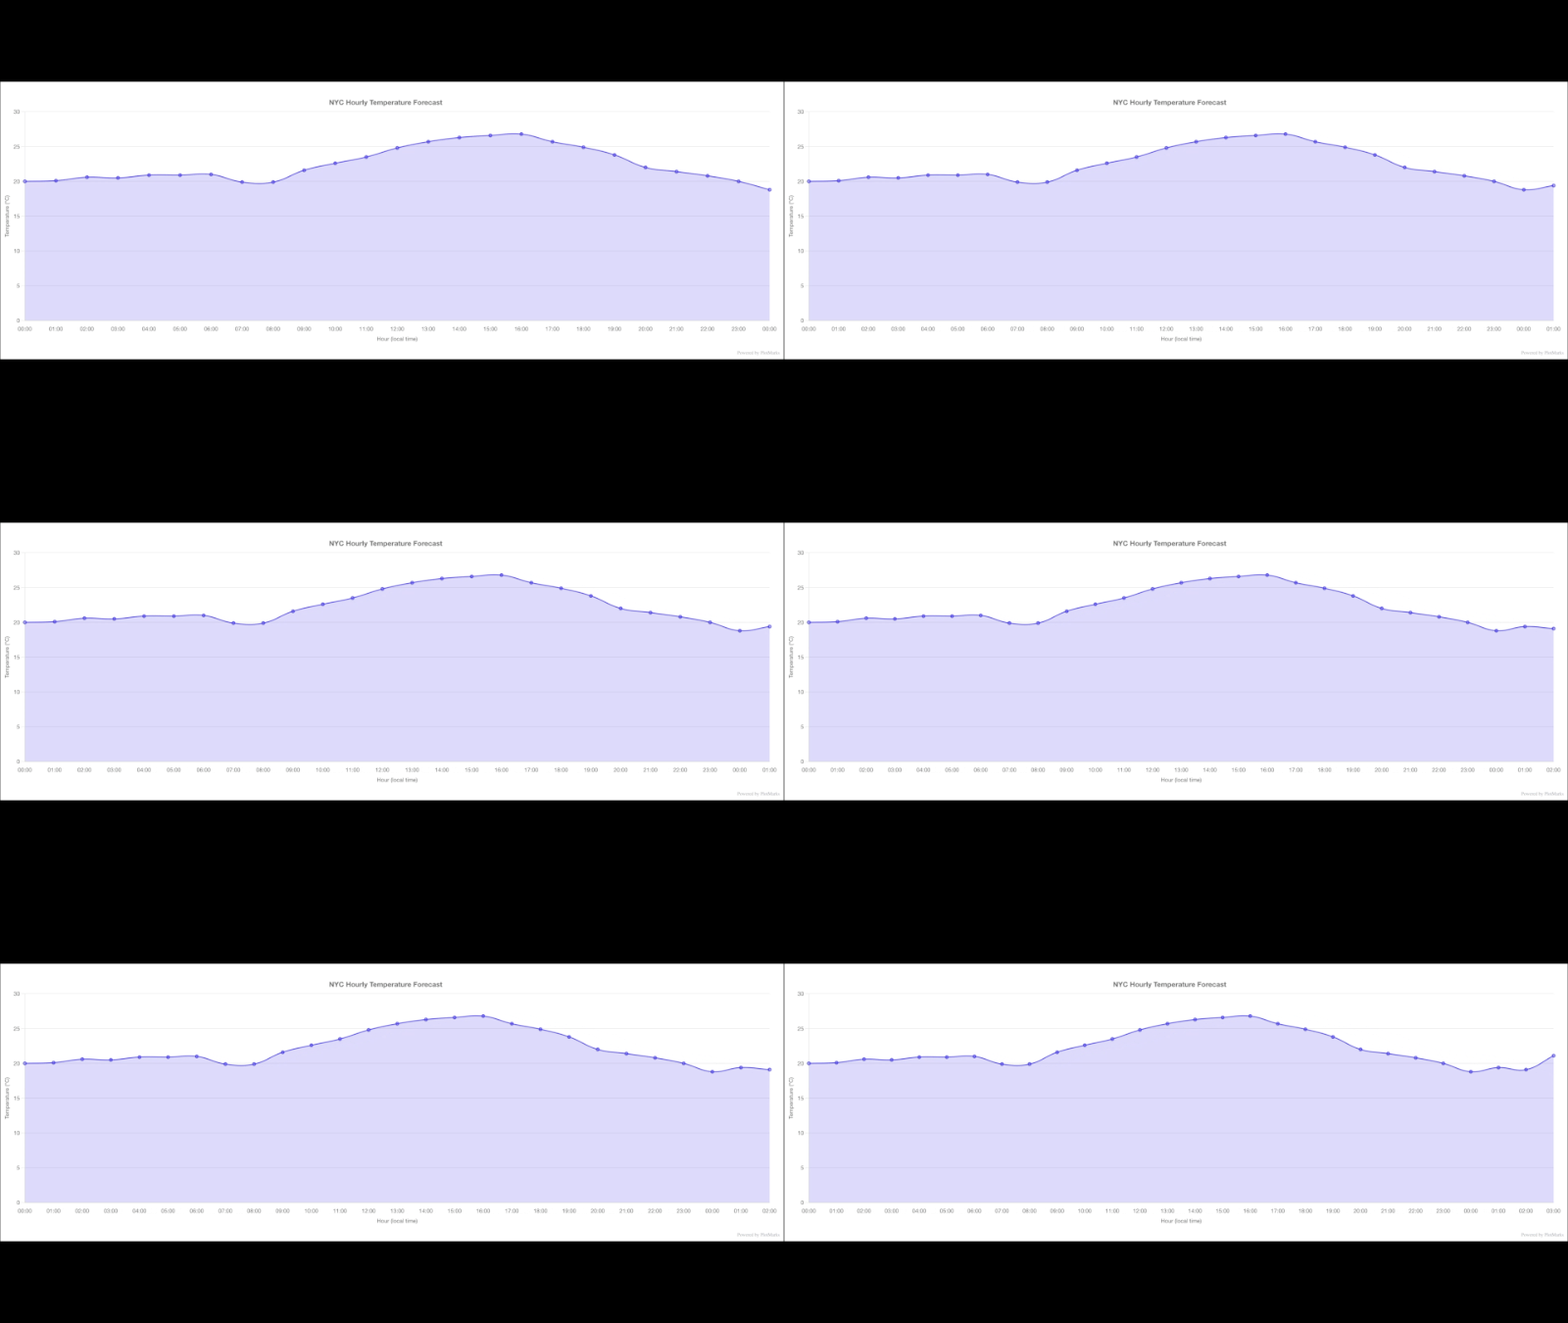
live_iframe chart updating in place each time the service pushes new data — no page reload, no iframe reload.What PlotMarks handles here
- Storing the current dataset
- Serving the chart as an embeddable page
- Rendering the chart in the browser
- Polling logic for live charts
The .NET code is two POST requests. PlotMarks removes the need for a hosted frontend that accepts data from the service and renders a chart from it.
Next steps
- Article 1: How to Build a Live Chart from a REST API — Python example using Open-Meteo weather data
- PlotMarks API reference — all chart types and configuration options
Ready to try it? Create a free PlotMarks account and push your first chart in minutes.
Get started free