You have a public REST API that returns data that changes over time. You want to embed a chart that reflects the current state of that data, without writing a frontend, without regenerating a new image on every update, and without requiring the viewer to reload the page to see new values.
This article shows how to do that. The example uses the free Open-Meteo weather API (no API key required), a short Python script, and PlotMarks for the persistent hosted chart.
What we are building
By the end of this article you will have a live line chart showing New York City's hourly temperature forecast for the day. A Python script fetches the forecast from the Open-Meteo weather API and pushes the data to a PlotMarks chart slot. The chart is embedded in any page via a single <iframe> tag. While the page is open, the chart polls for new data automatically and re-renders in place, with no page reload or iframe reload.
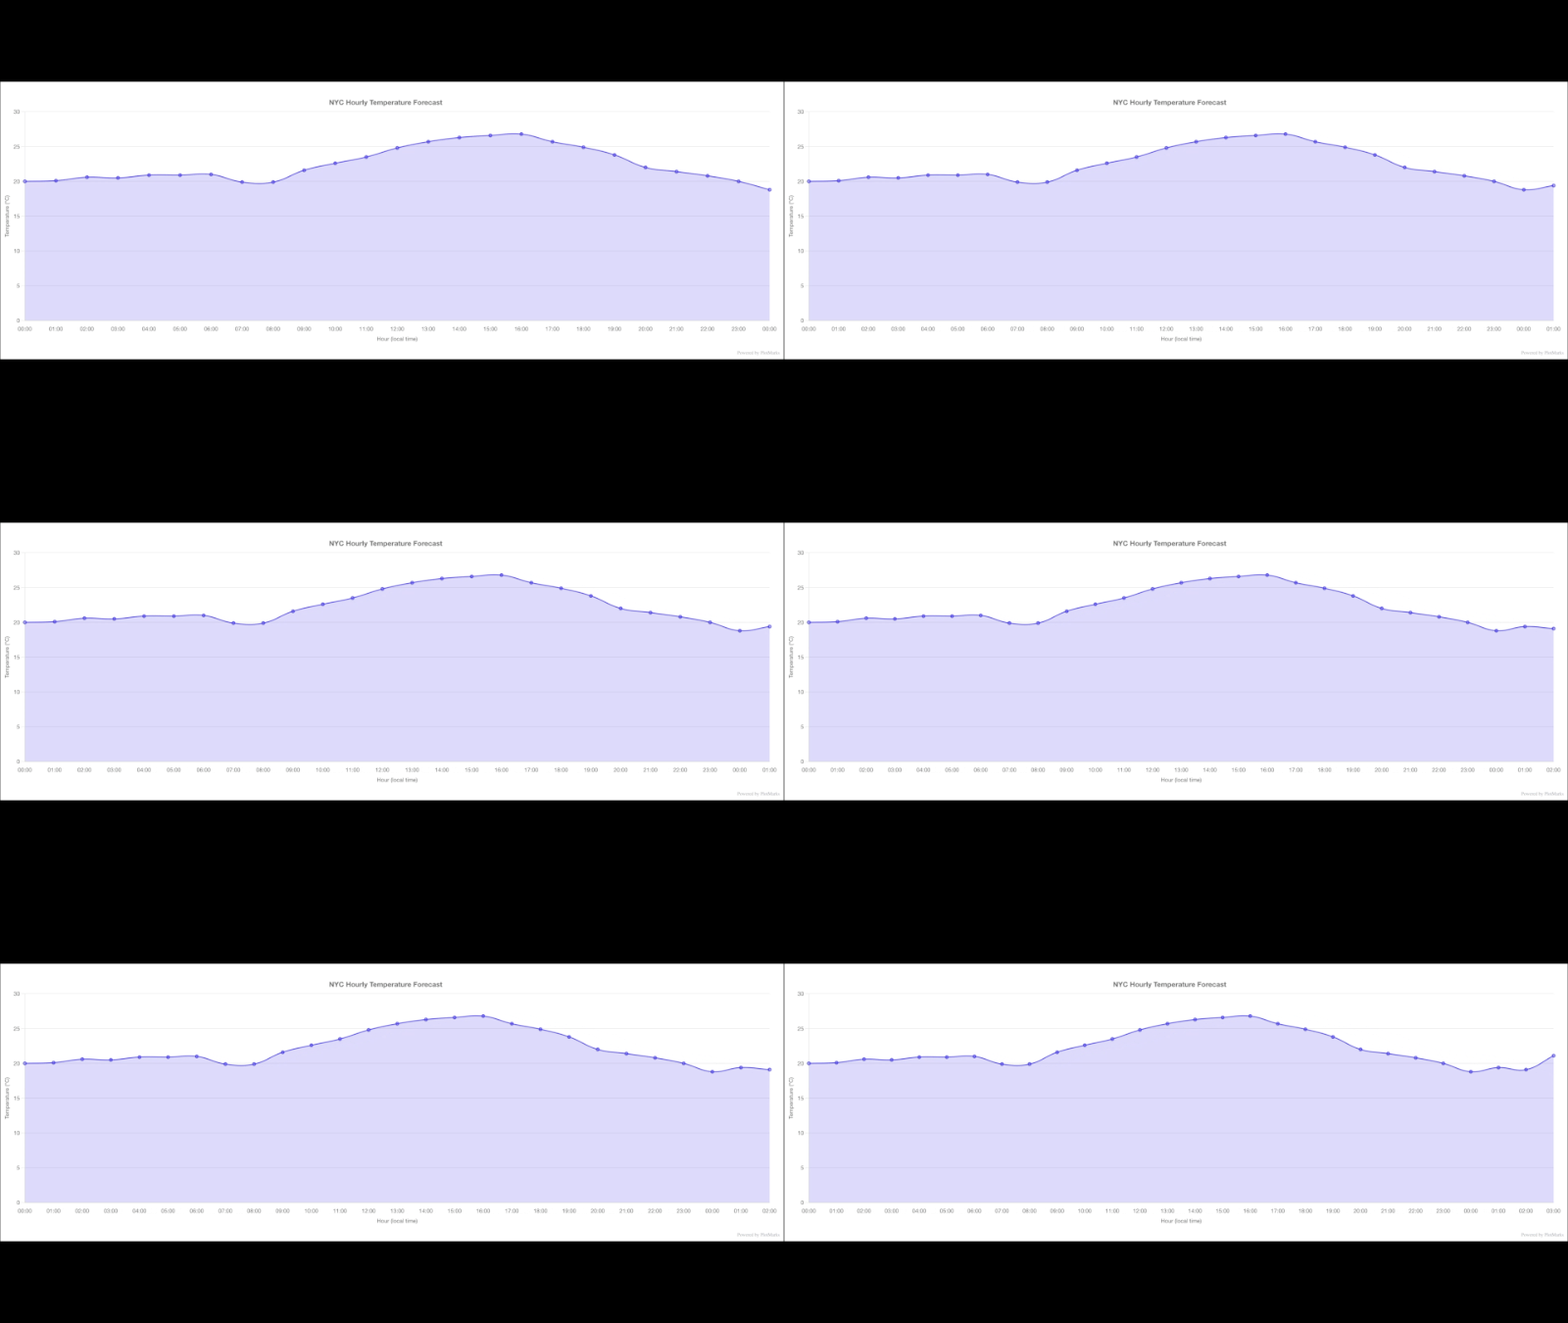
The script is about 60 lines of Python. There is no frontend to build or host. Once the chart slot is created you have a permanent embed URL that stays current for as long as the script is running.
The problem with the usual approaches
If you want to visualize live data without a frontend, the options usually involve one of:
- Generating a chart image on demand. The script produces a PNG file and stores or serves it. Every new dataset means a new file and often a new URL, so anything that embeds the chart breaks.
- Building and hosting a charting frontend. This works, but maintaining a small React or vanilla JS app just to show one chart is overhead that has nothing to do with the actual data.
- Using a full dashboard product. Often more than you need if the goal is a single embeddable chart kept current by an external process.
The model this article uses is different: create a chart slot once, get a persistent embed URL, and push new data to that URL whenever you need to. The URL never changes. The browser handles polling for updates automatically.
Architecture
flowchart LR
    A["Open-Meteo API"] -->|"GET /v1/forecast"| B["Python script\nfetch + transform"]
    B -->|"POST /api/charts/{id}/data"| C[("PlotMarks\nchart slot")]
    C -->|"persistent URL"| D["Embedded iframe\n(any page)"]
    D -->|"polls every N sec"| C
The Python script owns the data pipeline. PlotMarks stores the latest dataset and serves it to whatever is embedding the chart. The producer (the script) and the viewer (the iframe) operate independently. The script can push whenever it has new data, and the browser polls PlotMarks on its own schedule.
Prerequisites
- Python 3.8 or later
requestslibrary (pip install requests)- A PlotMarks account and API key: sign up free at plotmarks.com
Step 1: Create a chart slot
A chart slot is a persistent resource with its own ID and embed URL. You create it once, and it stays at the same URL regardless of how many times you update its data.
Run this once to provision the slot:
import os
import requests

PLOTMARKS_API = "https://www.plotmarks.com"
API_KEY = os.environ["PLOTMARKS_API_KEY"]
HEADERS = {"X-API-Key": API_KEY, "Content-Type": "application/json"}

def create_chart() -> str:
    payload = {
        "type": "line",
        "output_type": "live_iframe",
        "refresh_interval": 300,          # browser polls every 5 minutes
        "config": {
            "title": "NYC Hourly Temperature Forecast",
            "xLabel": "Hour (local time)",
            "yLabel": "Temperature (°C)"
        }
    }
    res = requests.post(f"{PLOTMARKS_API}/api/charts", json=payload, headers=HEADERS)
    res.raise_for_status()
    data = res.json()
    print(f"Chart ID : {data['id']}")
    print(f"Embed URL: {data['embedUrl']}")
    return data["id"]

if __name__ == "__main__":
    create_chart()
Response shape:
{
  "id": "ch_abc123",
  "embedUrl": "https://www.plotmarks.com/charts/ch_abc123"
}
Save the chart ID. You will pass it to the data-push script on every subsequent run. You do not need to create a new chart slot each time you update the data.
output_type and refresh_interval:
live_iframeinstructs the embedded iframe to poll PlotMarks for updates. Therefresh_intervalcontrols how often, in seconds. The minimum is 10 seconds; the free plan minimum is 30 seconds.static_iframecreates a persistent slot that also loads the latest data, but does not automatically refresh while a viewer has the page open. Use it when a page reload on next visit is acceptable.
Step 2: Fetch and transform data from Open-Meteo
Open-Meteo's forecast API returns hourly temperature data for any coordinate with no authentication:
def fetch_temperature() -> list[dict]:
    url = (
        "https://api.open-meteo.com/v1/forecast"
        "?latitude=40.7128&longitude=-74.0060"
        "&hourly=temperature_2m&forecast_days=1"
        "&timezone=America%2FNew_York"
    )
    res = requests.get(url)
    res.raise_for_status()
    hourly = res.json()["hourly"]

    # Build PlotMarks data points: x is the axis label, the other key is the series name
    return [
        {"x": t[11:16], "Temperature (°C)": round(v, 1)}
        for t, v in zip(hourly["time"], hourly["temperature_2m"])
    ]
Each item in the list becomes one point on the chart. The x field is the axis label (here, "HH:MM"). The other key, "Temperature (°C)", becomes the legend label on the chart.
Step 3: Push data to the chart
Posting to /api/charts/{id}/data replaces the chart's stored dataset with the new one. Every push is a full replacement; there is no append or delta operation.
def push_data(chart_id: str, data_points: list[dict]) -> None:
    payload = {
        "plots": [
            {
                "color": "#4F46E5",
                "fill": True,
                "thickness": 2,
                "data": data_points
            }
        ]
    }
    res = requests.post(
        f"{PLOTMARKS_API}/api/charts/{chart_id}/data",
        json=payload,
        headers=HEADERS
    )
    res.raise_for_status()
    print(f"Pushed {len(data_points)} points → {res.json()}")
A successful response is { "ok": true }.
plots is an array of series. This example has one series (one line on the chart). Each plot object carries its own color and style. Up to five plots (series) are supported per chart, which means you could overlay multiple temperature datasets (for example, the forecast against the previous day) by adding a second object to plots with a different color and data array.
Step 4: The complete backend
The previous steps each handled one concern in isolation. In practice you want a single script that acts as the backend: create the chart once on first run, persist the ID so it reuses the same slot on every subsequent run, then loop, fetching fresh data from the API and pushing it to PlotMarks on a fixed interval.
import os
import time
import requests

PLOTMARKS_API = "https://www.plotmarks.com"
API_KEY = os.environ["PLOTMARKS_API_KEY"]
HEADERS = {"X-API-Key": API_KEY, "Content-Type": "application/json"}

PUSH_INTERVAL = 300   # seconds between data pushes
CHART_ID_FILE = "chart_id.txt"


def create_chart() -> str:
    payload = {
        "type": "line",
        "output_type": "live_iframe",
        "refresh_interval": PUSH_INTERVAL,
        "config": {
            "title": "NYC Hourly Temperature Forecast",
            "xLabel": "Hour (local time)",
            "yLabel": "Temperature (°C)"
        }
    }
    res = requests.post(f"{PLOTMARKS_API}/api/charts", json=payload, headers=HEADERS)
    res.raise_for_status()
    data = res.json()
    print(f"Chart created  id={data['id']}")
    print(f"Embed URL: {data['embedUrl']}")
    return data["id"]


def load_or_create_chart() -> str:
    """Return the persisted chart ID, or create a new chart and save the ID."""
    if os.path.exists(CHART_ID_FILE):
        with open(CHART_ID_FILE) as f:
            chart_id = f.read().strip()
        print(f"Using existing chart: {chart_id}")
        return chart_id
    chart_id = create_chart()
    with open(CHART_ID_FILE, "w") as f:
        f.write(chart_id)
    return chart_id


def fetch_temperature() -> list[dict]:
    url = (
        "https://api.open-meteo.com/v1/forecast"
        "?latitude=40.7128&longitude=-74.0060"
        "&hourly=temperature_2m&forecast_days=1"
        "&timezone=America%2FNew_York"
    )
    res = requests.get(url)
    res.raise_for_status()
    hourly = res.json()["hourly"]
    return [
        {"x": t[11:16], "Temperature (°C)": round(v, 1)}
        for t, v in zip(hourly["time"], hourly["temperature_2m"])
    ]


def push_data(chart_id: str, data_points: list[dict]) -> None:
    payload = {
        "plots": [
            {
                "color": "#4F46E5",
                "fill": True,
                "thickness": 2,
                "data": data_points
            }
        ]
    }
    res = requests.post(
        f"{PLOTMARKS_API}/api/charts/{chart_id}/data",
        json=payload,
        headers=HEADERS
    )
    res.raise_for_status()
    print(f"Pushed {len(data_points)} points → {res.json()}")


if __name__ == "__main__":
    chart_id = load_or_create_chart()
    print(f"Loop started — pushing every {PUSH_INTERVAL}s. Ctrl+C to stop.")
    while True:
        try:
            data_points = fetch_temperature()
            push_data(chart_id, data_points)
        except Exception as e:
            print(f"Error: {e}")
        time.sleep(PUSH_INTERVAL)
Run it once and leave it running:
export PLOTMARKS_API_KEY="your_api_key_here"
python weather_chart.py
# Chart created  id=ch_abc123
# Embed URL: https://www.plotmarks.com/charts/ch_abc123
# Loop started — pushing every 300s. Ctrl+C to stop.
# Pushed 24 points → {'ok': True}
On the first run it creates the chart and writes chart_id.txt. Every run after that reads the file and reuses the same slot, so the embed URL never changes. If the fetch or push fails for any reason the loop catches the error, prints it, and continues on the next cycle rather than crashing.
The frontend only needs the embed URL from that first run. Drop it into an iframe once and it stays current as long as the script is running.
Step 5: Embed the chart
The embed URL returned when you created the chart is a public page. No API key or login is required to view it. Drop it into an iframe:
<iframe
  src="https://www.plotmarks.com/charts/ch_abc123"
  width="640"
  height="360"
  frameborder="0"
  style="border-radius: 8px"
></iframe>
For a responsive layout:
<!-- 16:9 aspect ratio; change padding-top to 75% for 4:3 -->
<div style="position:relative; width:100%; padding-top:56.25%; overflow:hidden; border-radius:8px">
  <iframe
    src="https://www.plotmarks.com/charts/ch_abc123"
    style="position:absolute; inset:0; width:100%; height:100%; border:0"
  ></iframe>
</div>
How the live behavior works
sequenceDiagram
    participant S as Python script
    participant PM as PlotMarks
    participant B as Browser (iframe)

    Note over S,PM: One-time setup
    S->>PM: POST /api/charts (create slot)
    PM-->>S: { id, embedUrl }

    loop Each time new data is available
        S->>PM: POST /api/charts/{id}/data
        PM-->>S: { ok: true }
    end

    Note over PM,B: Viewer opens the page
    B->>PM: GET /api/charts/{id}/data
    PM-->>B: { plots, refreshInterval: 300 }
    B->>B: render chart

    loop Every refresh_interval seconds
        B->>PM: GET /api/charts/{id}/data
        PM-->>B: latest dataset
        B->>B: update chart in place
    end
When a browser loads a live_iframe chart page, it calls GET /api/charts/{id}/data immediately to render the initial state, then sets a setInterval timer at the refresh_interval you configured. Each poll replaces the chart's data without reloading the page or the iframe. The chart updates in place.
The polling happens entirely in the browser. PlotMarks does not push updates to viewers.
Because the data endpoint has no caching (Cache-Control: no-store), every poll hits PlotMarks directly and returns whatever dataset was most recently pushed.
Producer and viewer schedules are independent. In this example the refresh_interval is 300 seconds, meaning the chart checks for updates every 5 minutes. If you run the update script more frequently than that, some updates will be skipped by an open viewer; the chart will show the most recent push as of the next poll cycle. If you run the script less frequently, the viewer simply sees the same data across multiple poll cycles.
What PlotMarks removes from the picture
The chart hosting, polling logic, and embed infrastructure are handled by PlotMarks. The Python script's only job is fetching data from Open-Meteo and formatting it correctly. The total PlotMarks-specific code is about 20 lines.
A developer would need to build or maintain their own solution if they wanted the same result without an external service:
- A server that stores the current dataset
- A chart rendering frontend that polls that server
- Hosting for both
- An embed mechanism that works across different sites
Whether that overhead is worth avoiding depends on the project. PlotMarks is a reasonable choice when you have a small number of charts that need to be updated by external processes and embedded somewhere.
When this approach is not the right fit
If your chart lives entirely inside an application you already control, a dashboard within your own React app for example, adding a third-party service to host a single chart introduces more complexity than it removes. In that case, Chart.js or a similar library embedded directly in your frontend is the simpler choice.
PlotMarks is a better fit when the producer and consumer are decoupled: a backend script, cron job, CI pipeline, or webhook handler that needs to publish a result somewhere, and an embed on a static site, documentation page, or external tool that needs to display it.
Ready to try it? Create a free PlotMarks account and push your first chart in minutes.
Get started free